John
Enthusiast.
- Joined
- Jan 1, 2000
- Messages
- 3,935
- Reaction score
- 6,026
- Points
- 113
- Location
- North Nottinghamshire.
- My Satellite Setup
-
Elite 2.2 PF - CM1.8 - CM1.2 - Gibertini 1.25.
Ku - Ka -C & Ext C.
PC cards-TM5402 receivers.
Promax FSM.
- My Location
- North Nottinghamshire.
@John
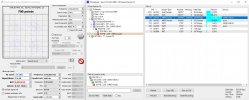
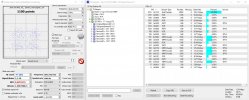
In relation to the 5G filter discussion in the 40.5W topic I did a spectrum scan of 38.0 East with my Promax in both H and V polarities.
The screen shots are attached below.
Would you please be able to cast your "5G guru" eyes over my two spectra and let me know if you think I am getting 5G interference?
I set the red marker line at 3700 MHz which is just below the lowest C-Band frequency on 38.0 (3717V).
The spectra are inverted as is the norm with the Promax, ie, higher frequencies to the left and lower frequencies to the right.
Promax Settings were:
Span = Full Band
Satellite Band = C-Band
L.O. = 5150
.
View attachment 144387 View attachment 144388
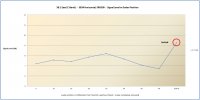
The 3.7 GHz upwards plot looks extremely un-even with loads of spurs - Point the dish upwards away from the arc and not directly into the sun and any signals. If using a normal non-5G lnb/lnbf the frequency span plot should be quite flat from 3.6 to 4.2 depending on the quality of the lnb/f in use and not look like your plot - are you using a SatMaximum 13k internal 5G lnb for the plots by any chance 'cos my same SatMaximum lnb gave the same sort of plot display so put it to the side in favour of using the AliEx External one. Your supplied 3.7GHz and down to 3.4GHz area plots ,to me, do not show any 5G interference , you might have to observe for a while as well as with me activity levels increase and decrease randomly - If yo do have 5G interference it will look something like this grab of mine
or
Last edited:


